How to set up Next.js error monitoring
Mar 18, 2025

Errors are an inevitable part of software development, but so is catching and fixing them. You can use error tracking in PostHog to help you do this.
To help you set this up, this tutorial details how to create a basic Next.js app, set up PostHog on both the front and backend, and then automatically capture errors that happen in both locations.
1. Creating a Next.js app
Start by ensuring Node.js is installed (version 18.0 or newer) then run the following command. Say no to TypeScript, yes to app router, and the defaults for other options.
Next, we can create our frontend which will have two parts:
- A button that throws an error
- A button that makes a request to our backend API
We can modify app/page.js to do this:
Next, we need to set up our API. To do this, create a new api directory inside the app directory, a test-error directory inside that, and then a route.js file inside that. In this file, create a basic GET() function that throws an error like this:
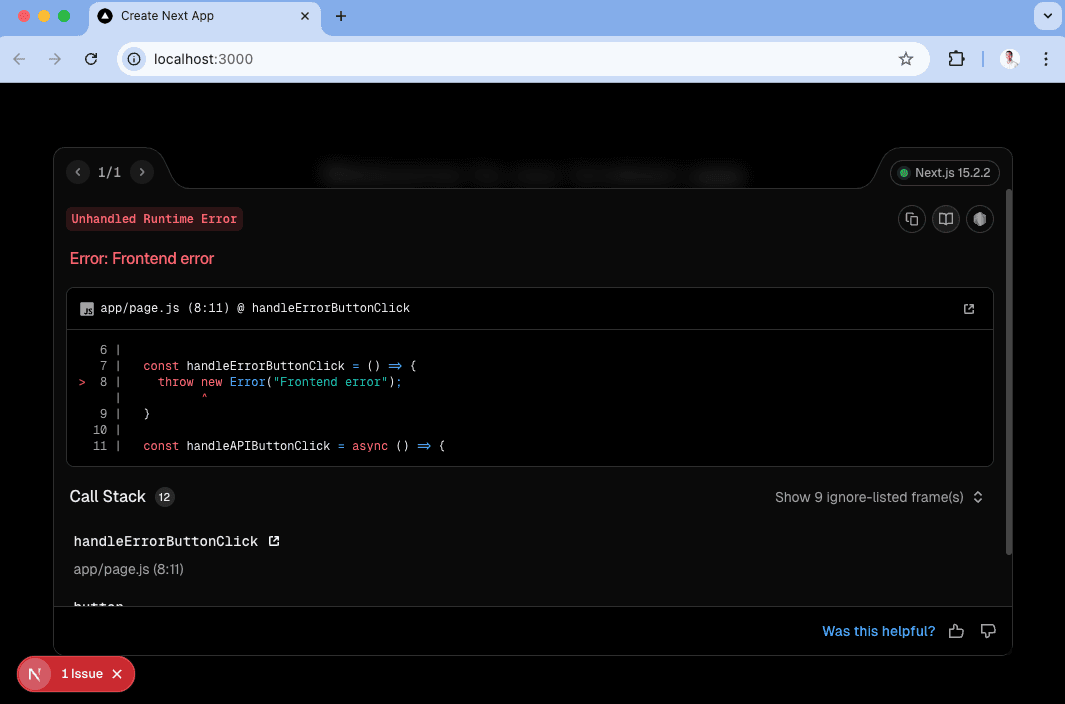
Once saved, run npm run dev to see your new app in action. Click either of the buttons to see the errors they trigger.
2. Setting up PostHog
To start, in your PostHog project settings under error tracking, toggle on Enable exception autocapture. Once done, go back to your app and install both posthog-js and posthog-node:
Frontend setup
We’ll set up PostHog in the frontend first. This starts by creating a providers.js file in the app directory. In it, we initialize PostHog with your project API key and host from your project settings and pass it to a PostHogProvider.
We then import this into layout.js and wrap our app in it like this:
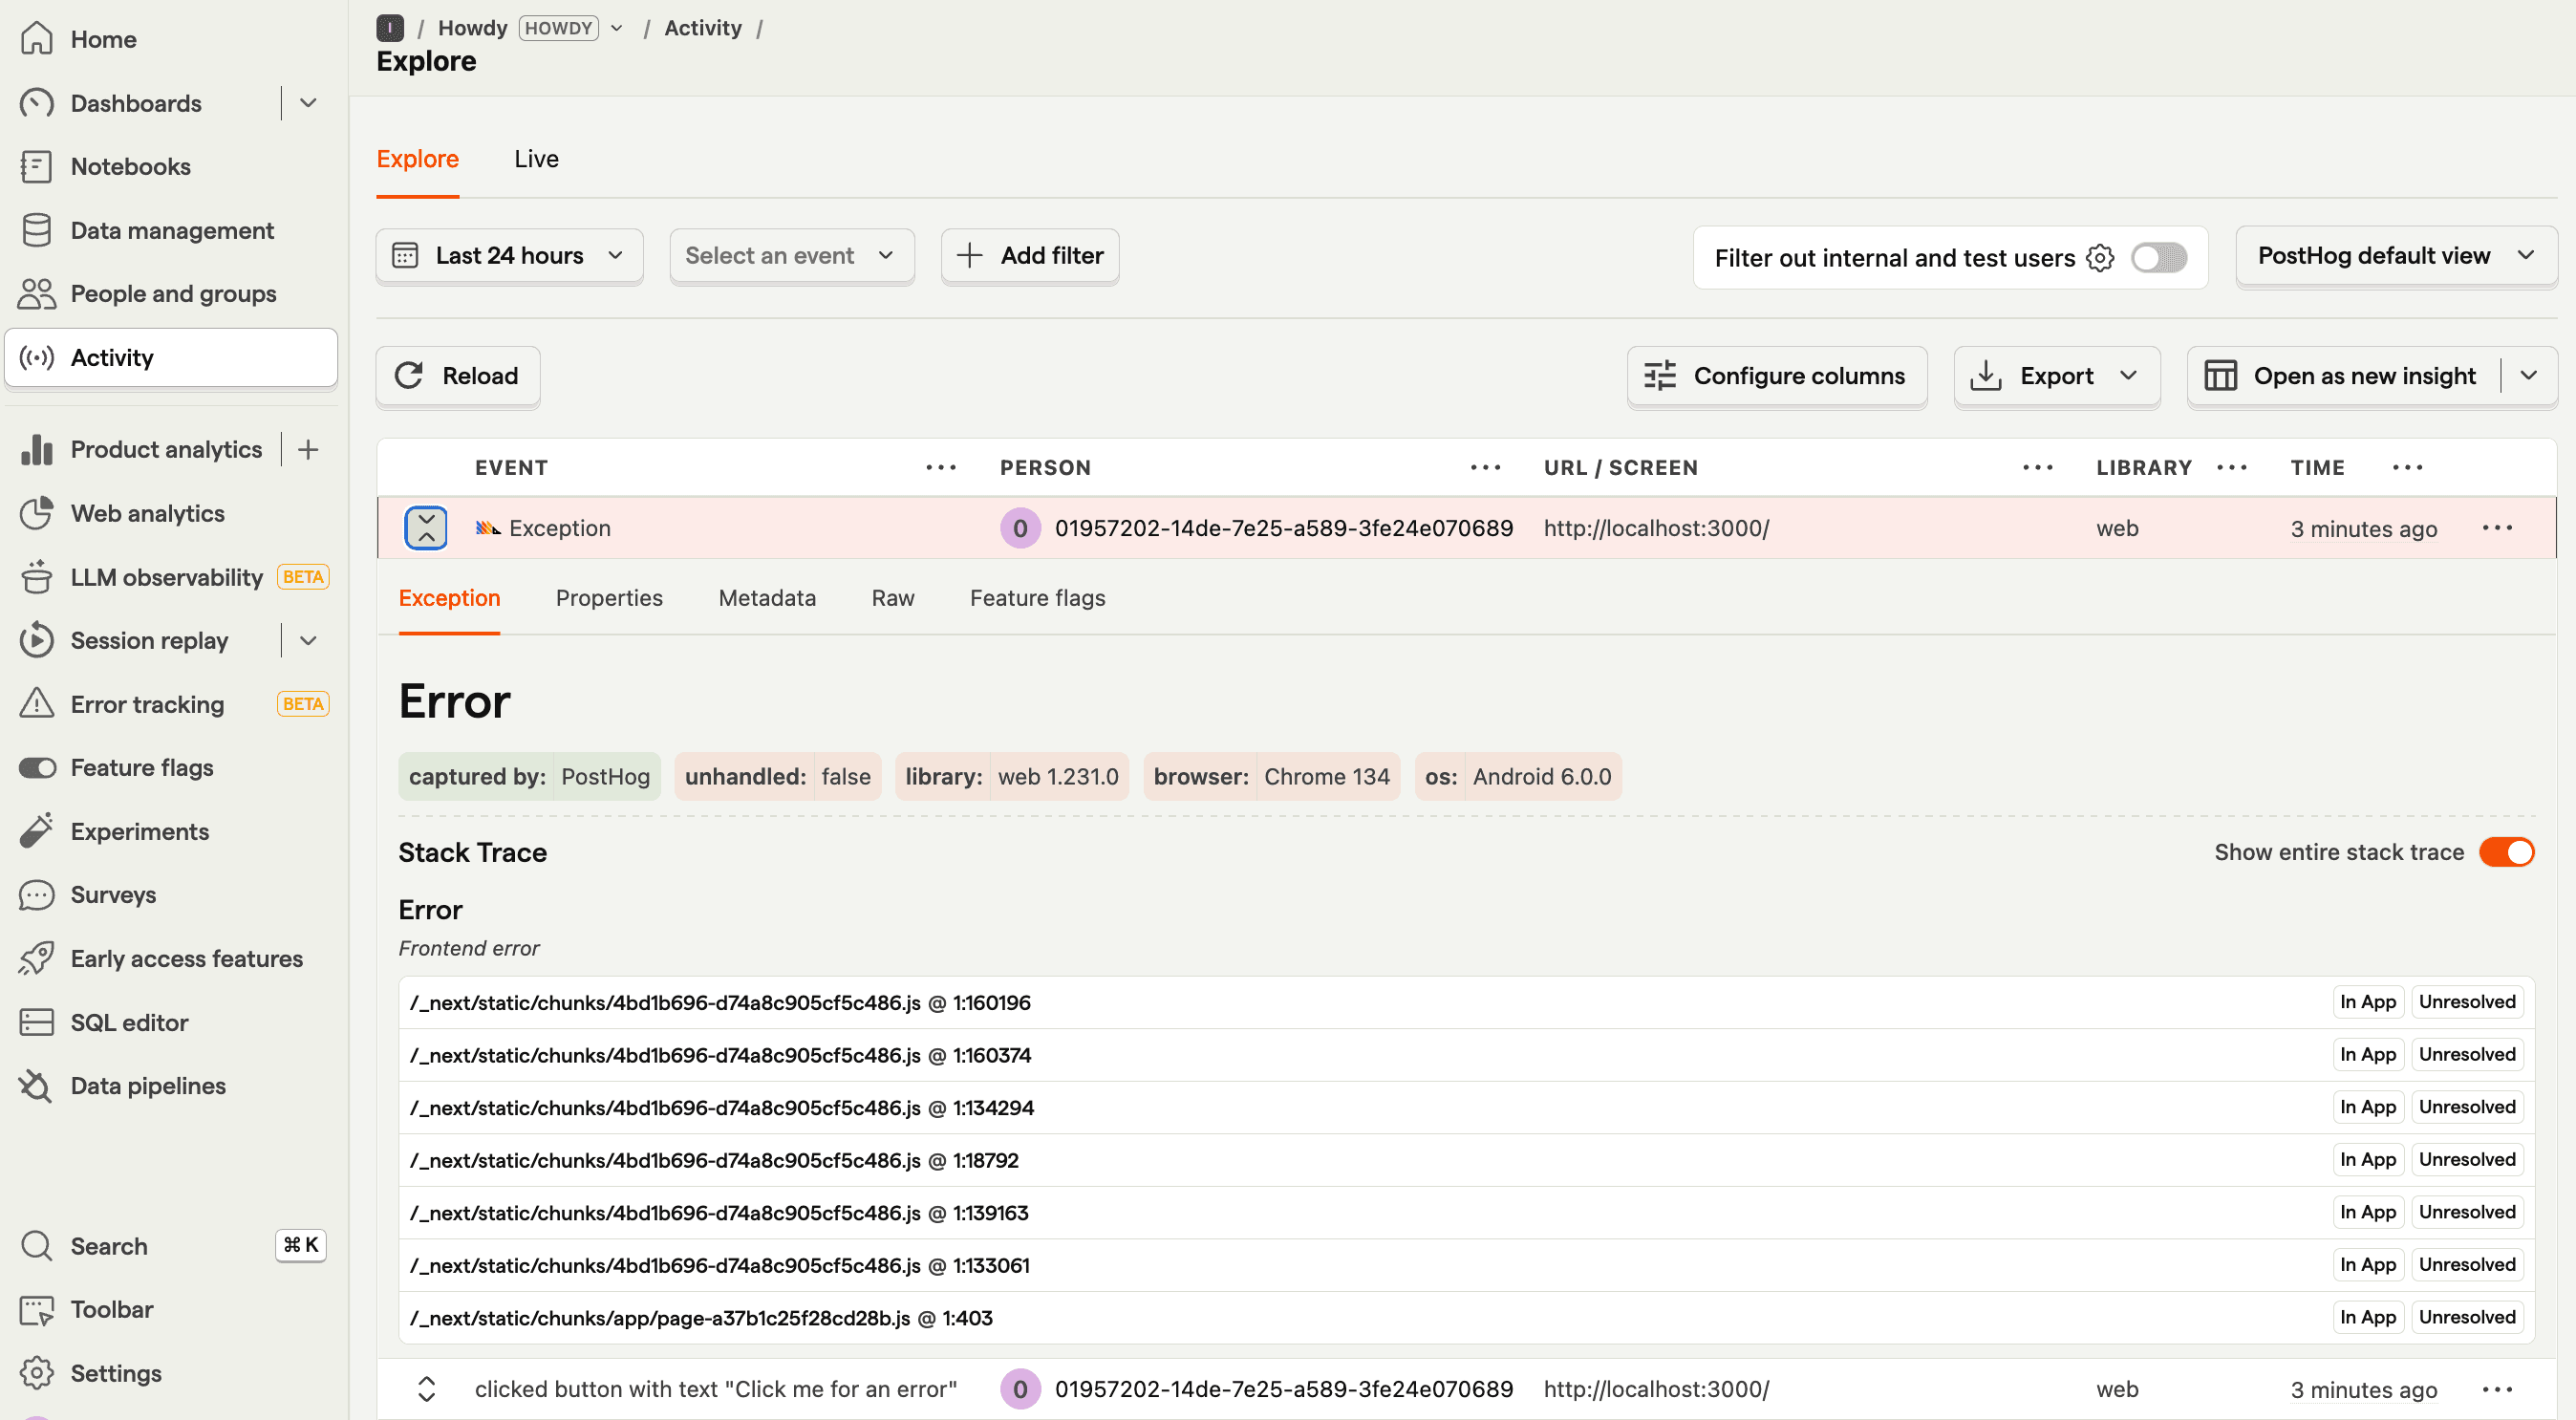
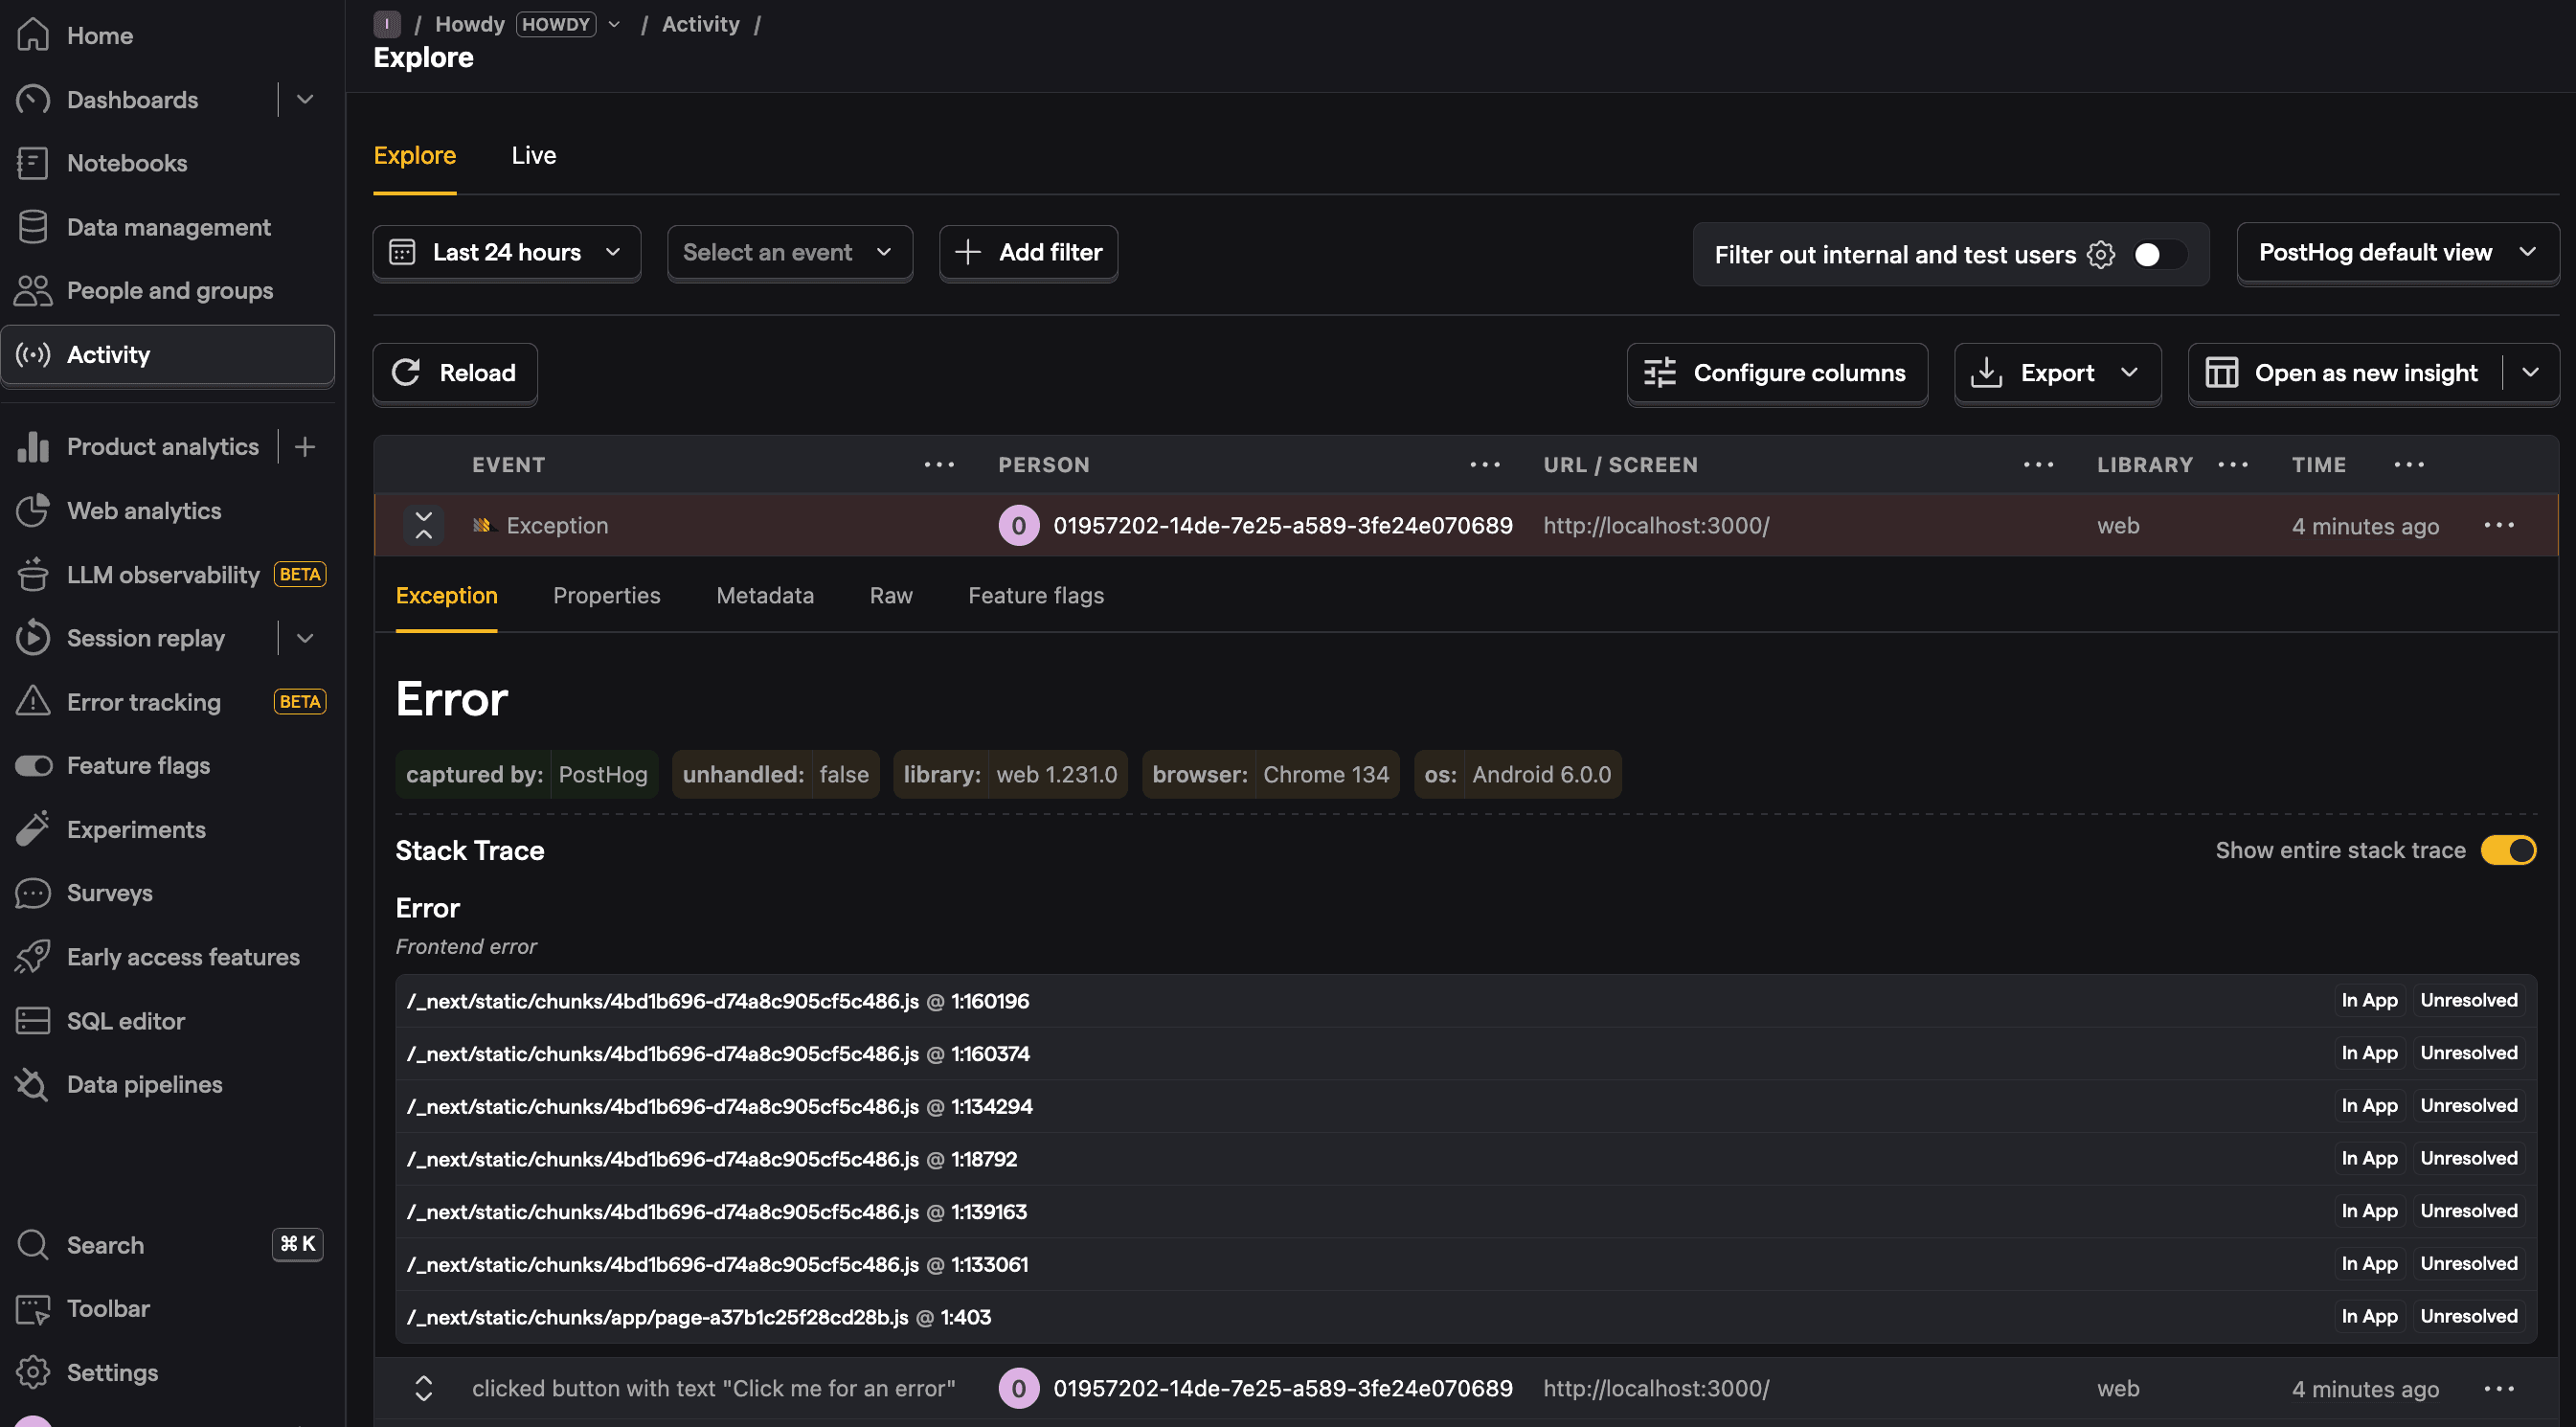
PostHog then begins to autocapture events and frontend errors. If you go back to your app and click the Click me for an error button, you’ll see an $exception event captured into PostHog.
Backend setup
For the backend, we can create a posthog-server.js file in the app directory. In it, initialize PostHog from posthog-node as a singleton with your project API key and host from your project settings. This looks like this:
We can then import this singleton wherever we need it in the backend. Unfortunately, this doesn’t autocapture errors by default, so we have some more work to do.
3. Capturing errors
With both front and backend initializations set up, capturing errors with PostHog is as simple as calling captureException or capturing an $exception event.
Doing this for every possible error is a hassle though and we'll inevitably miss errors we’re not expecting. Our frontend implementation automatically captures errors thrown and caught by onError and onUnhandledRejection listeners, but this doesn’t cover everything.
To capture more, we can set up some more boundaries and instrumentation.
How to capture frontend render errors
To ensure all component errors are tracked, we can use the built-in error boundary system. This is done by creating an error.jsx file like this:
This triggers when there is an error rendering your component. You can test this by setting up a useEffect in our page.js file that triggers a render error like this:
You can also create a similar global-error.jsx file to capture errors affecting the root layout or more granular error boundaries by adding error.jsx files to specific route segments.
How to automatically capture backend errors
Because backend requests in Next.js vary between server-side rendering, short-lived processes and more, we can’t rely on exception autocapture.
Instead, we create a instrumentation.js file at the root of our project and set up an onRequestError handler there. Importantly, we to both check the request is running in the nodejs runtime to ensure PostHog works and get the distinct_id from the cookie to connect the error to a specific user.
This looks like this:
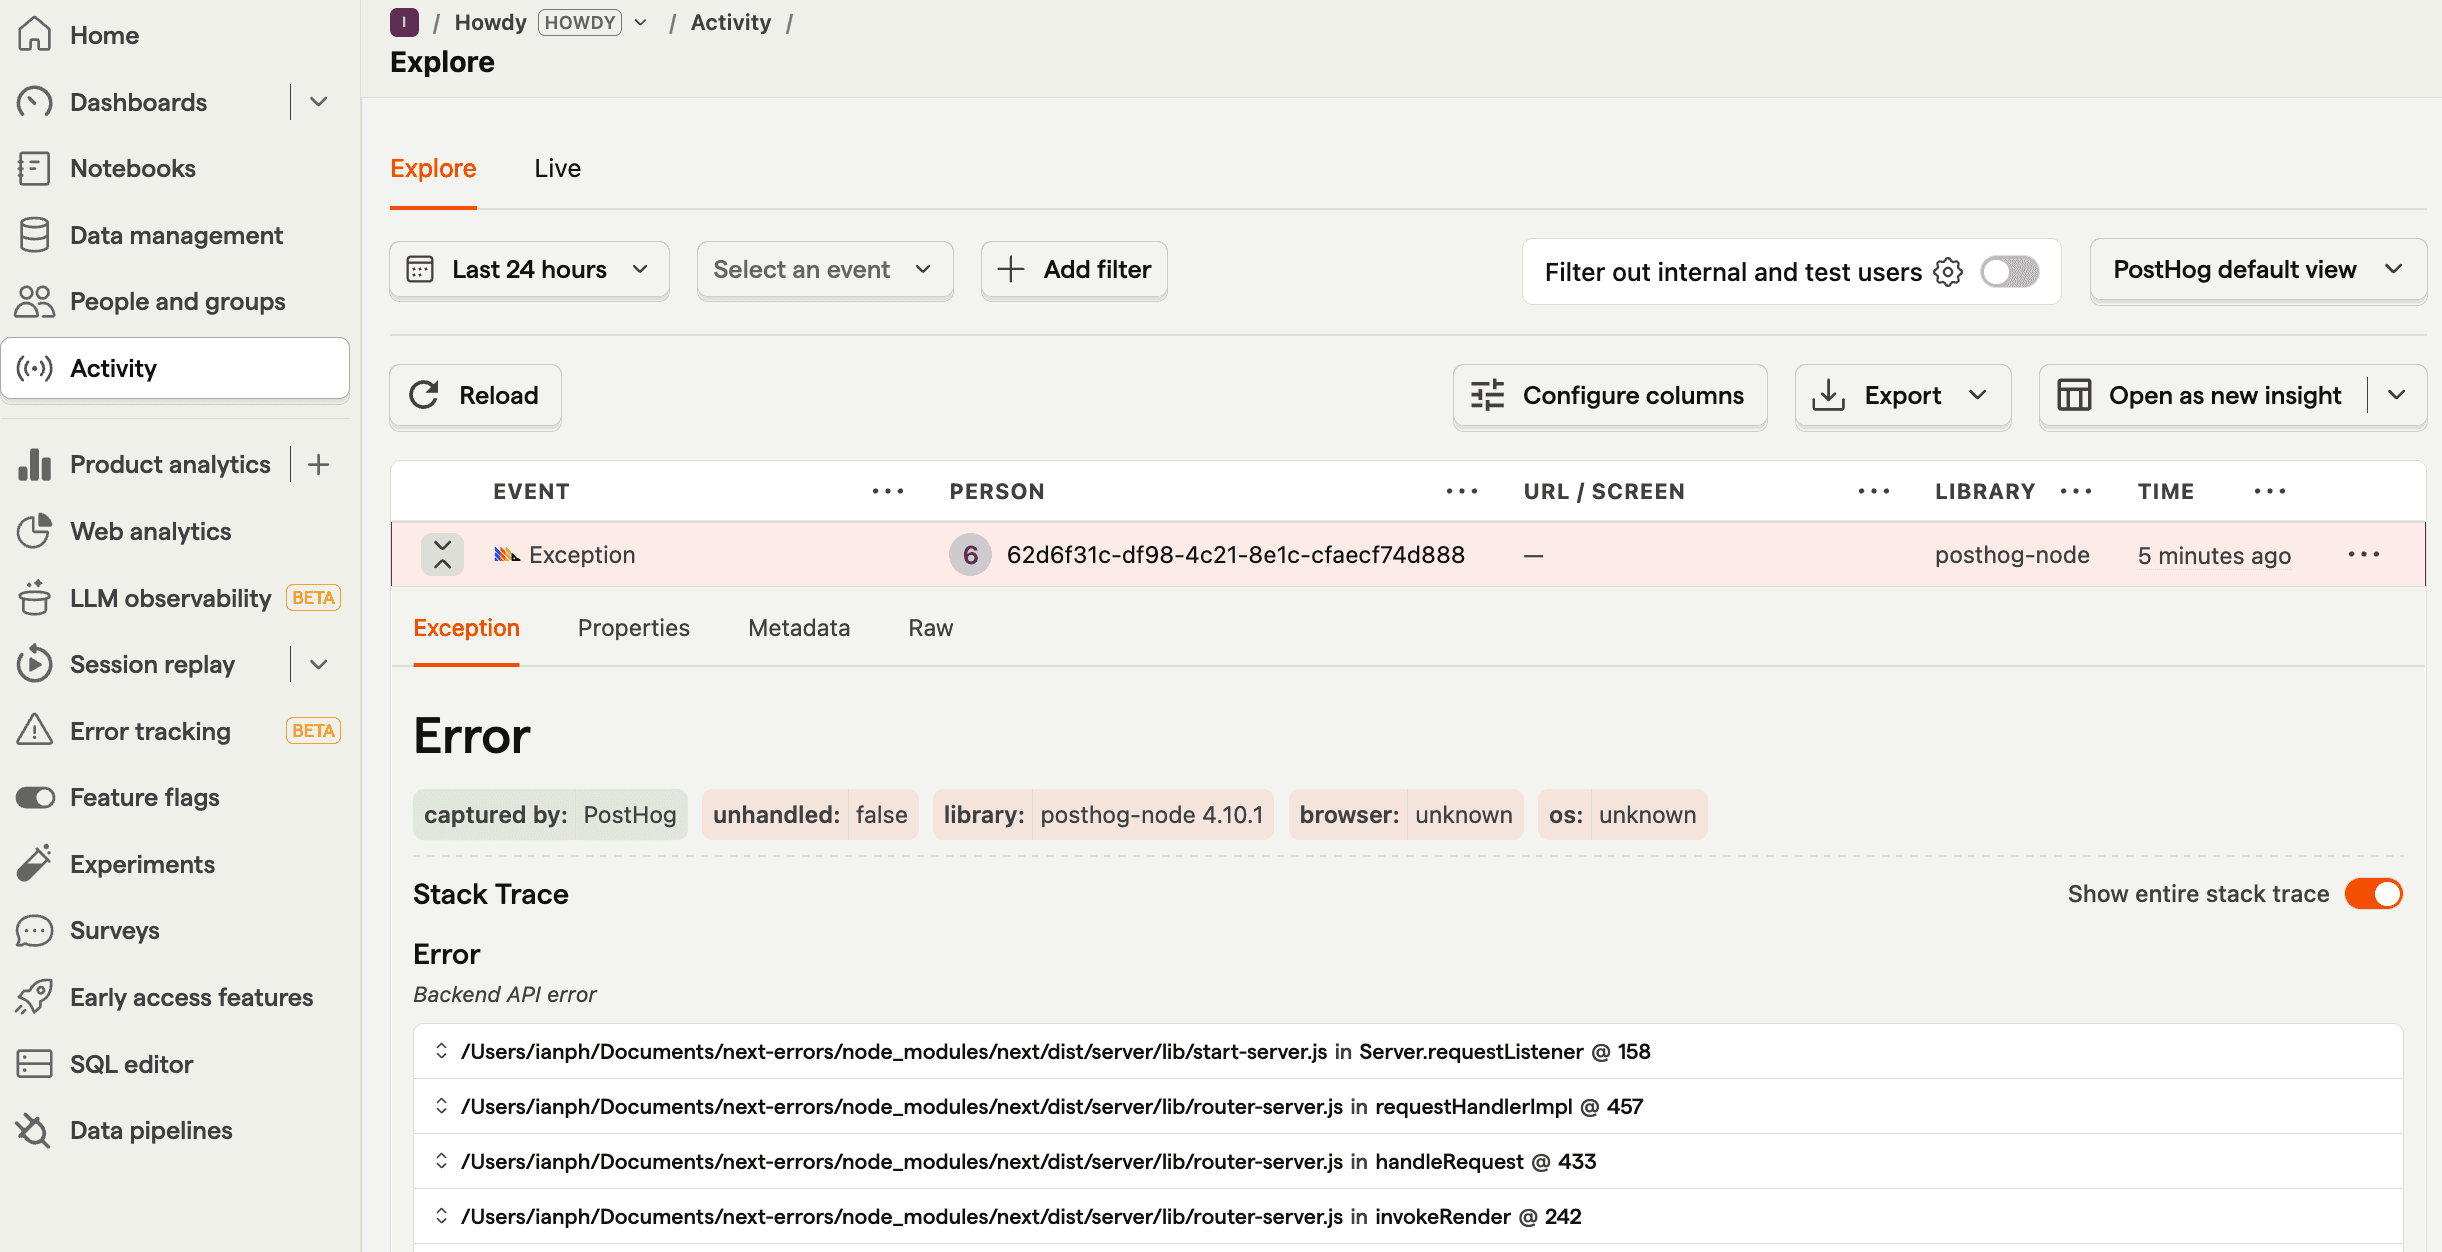
Now, when you click the Click me for a backend API error button, it will trigger an error which will be automatically captured by PostHog.
4. Monitoring errors in PostHog
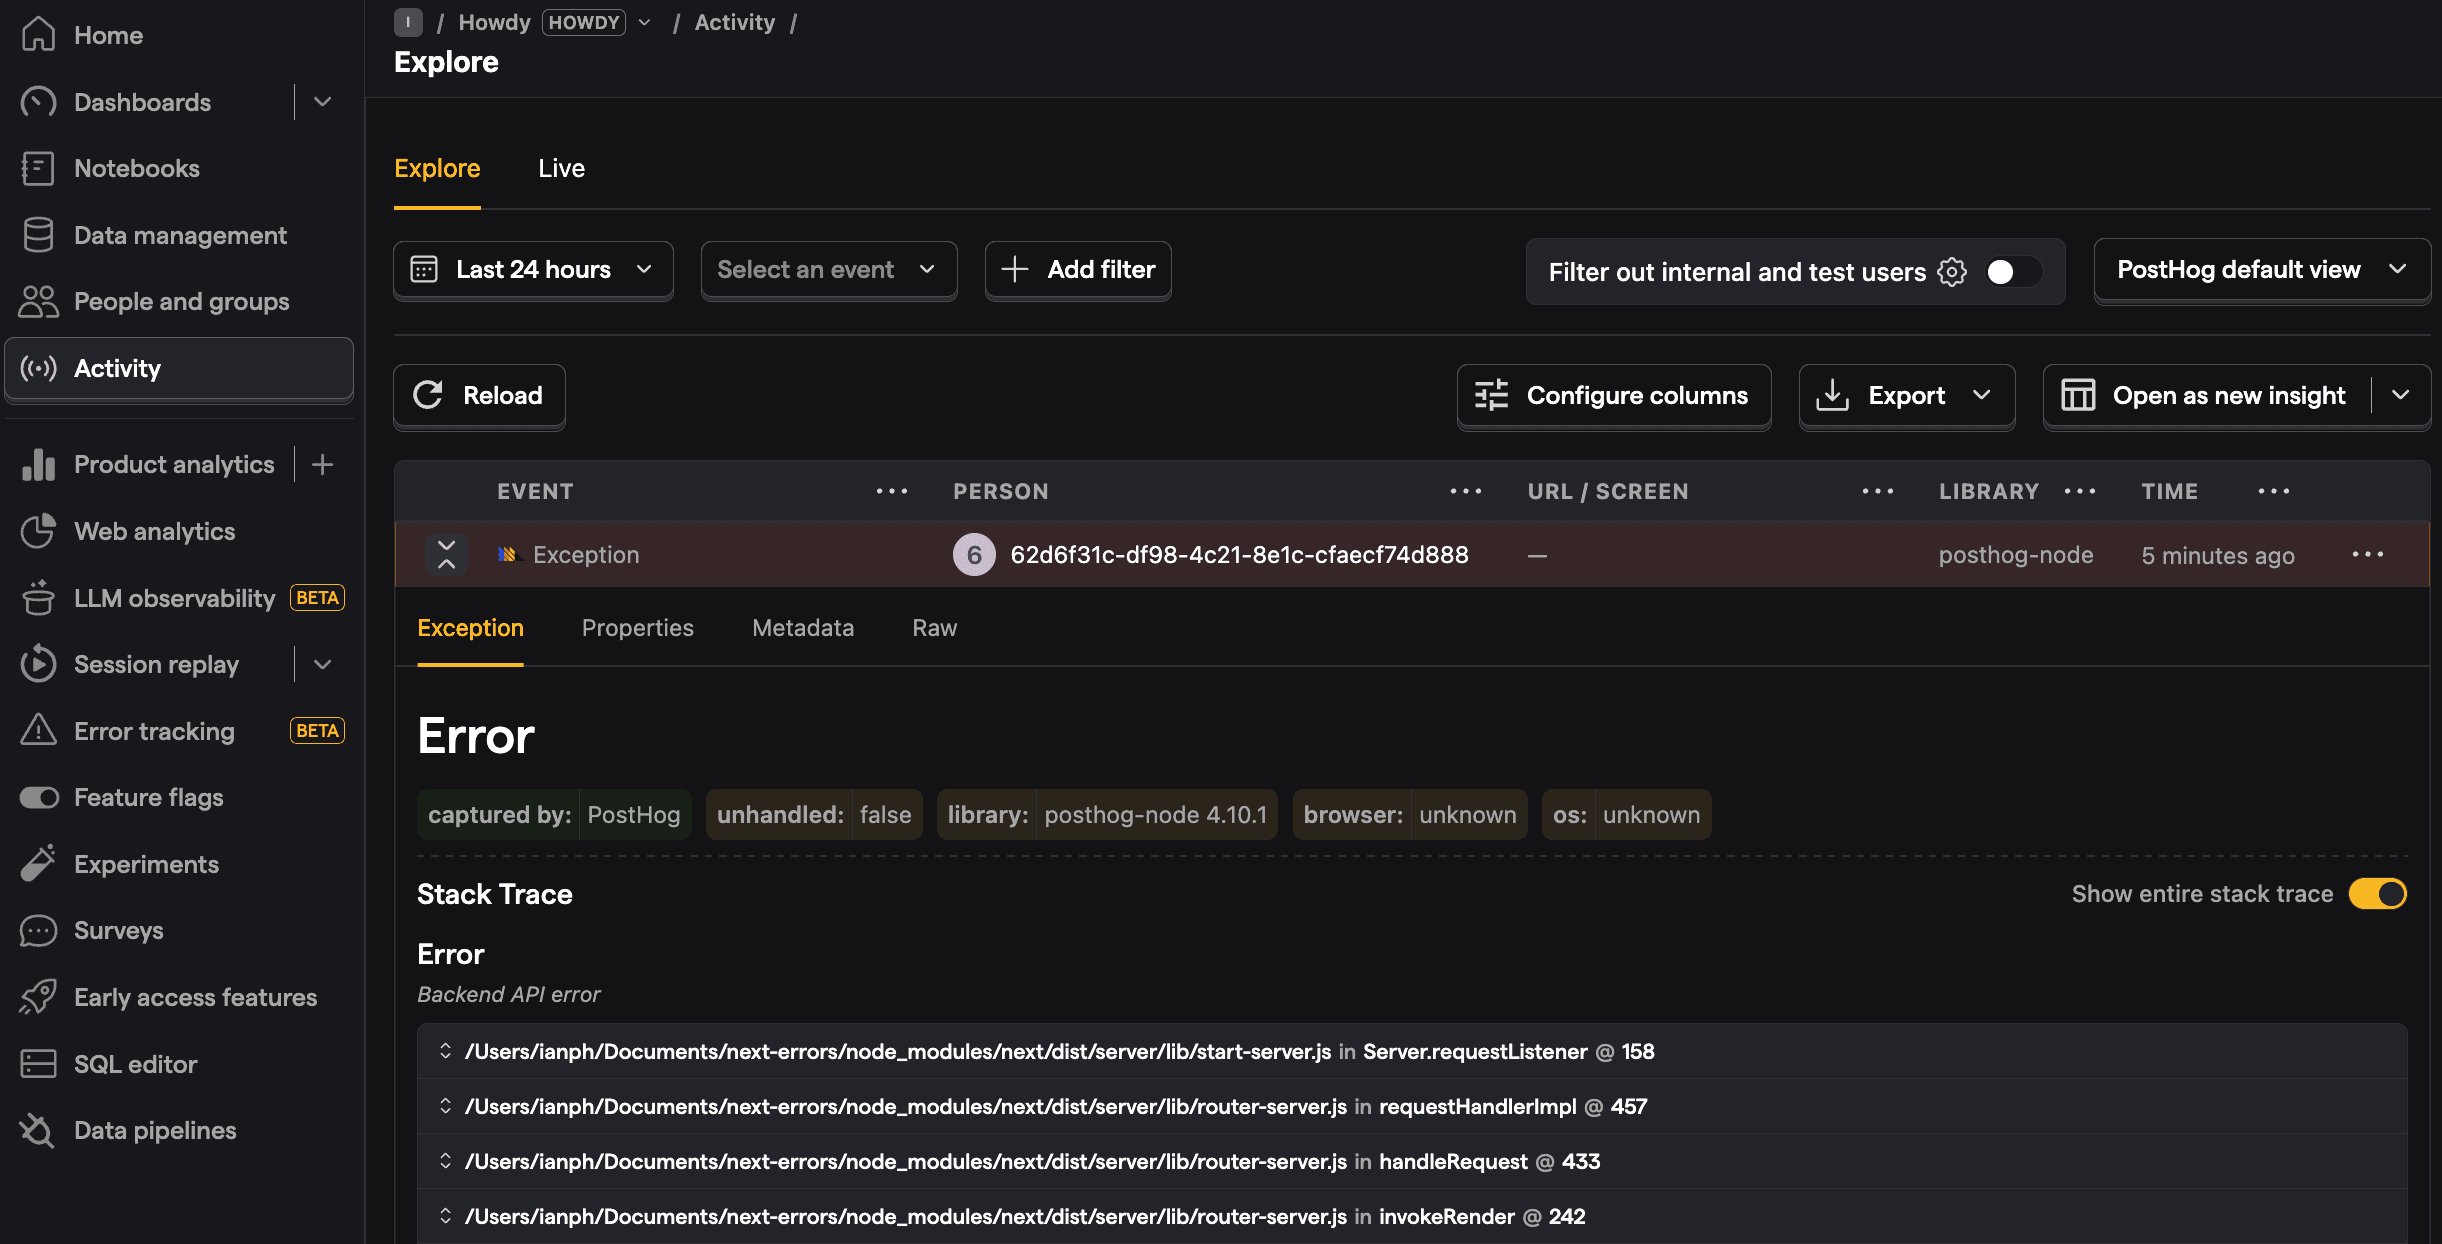
Once you’ve set up error capture in your app, you can head to the error tracking tab in PostHog to review the issues popping up along with their frequency.
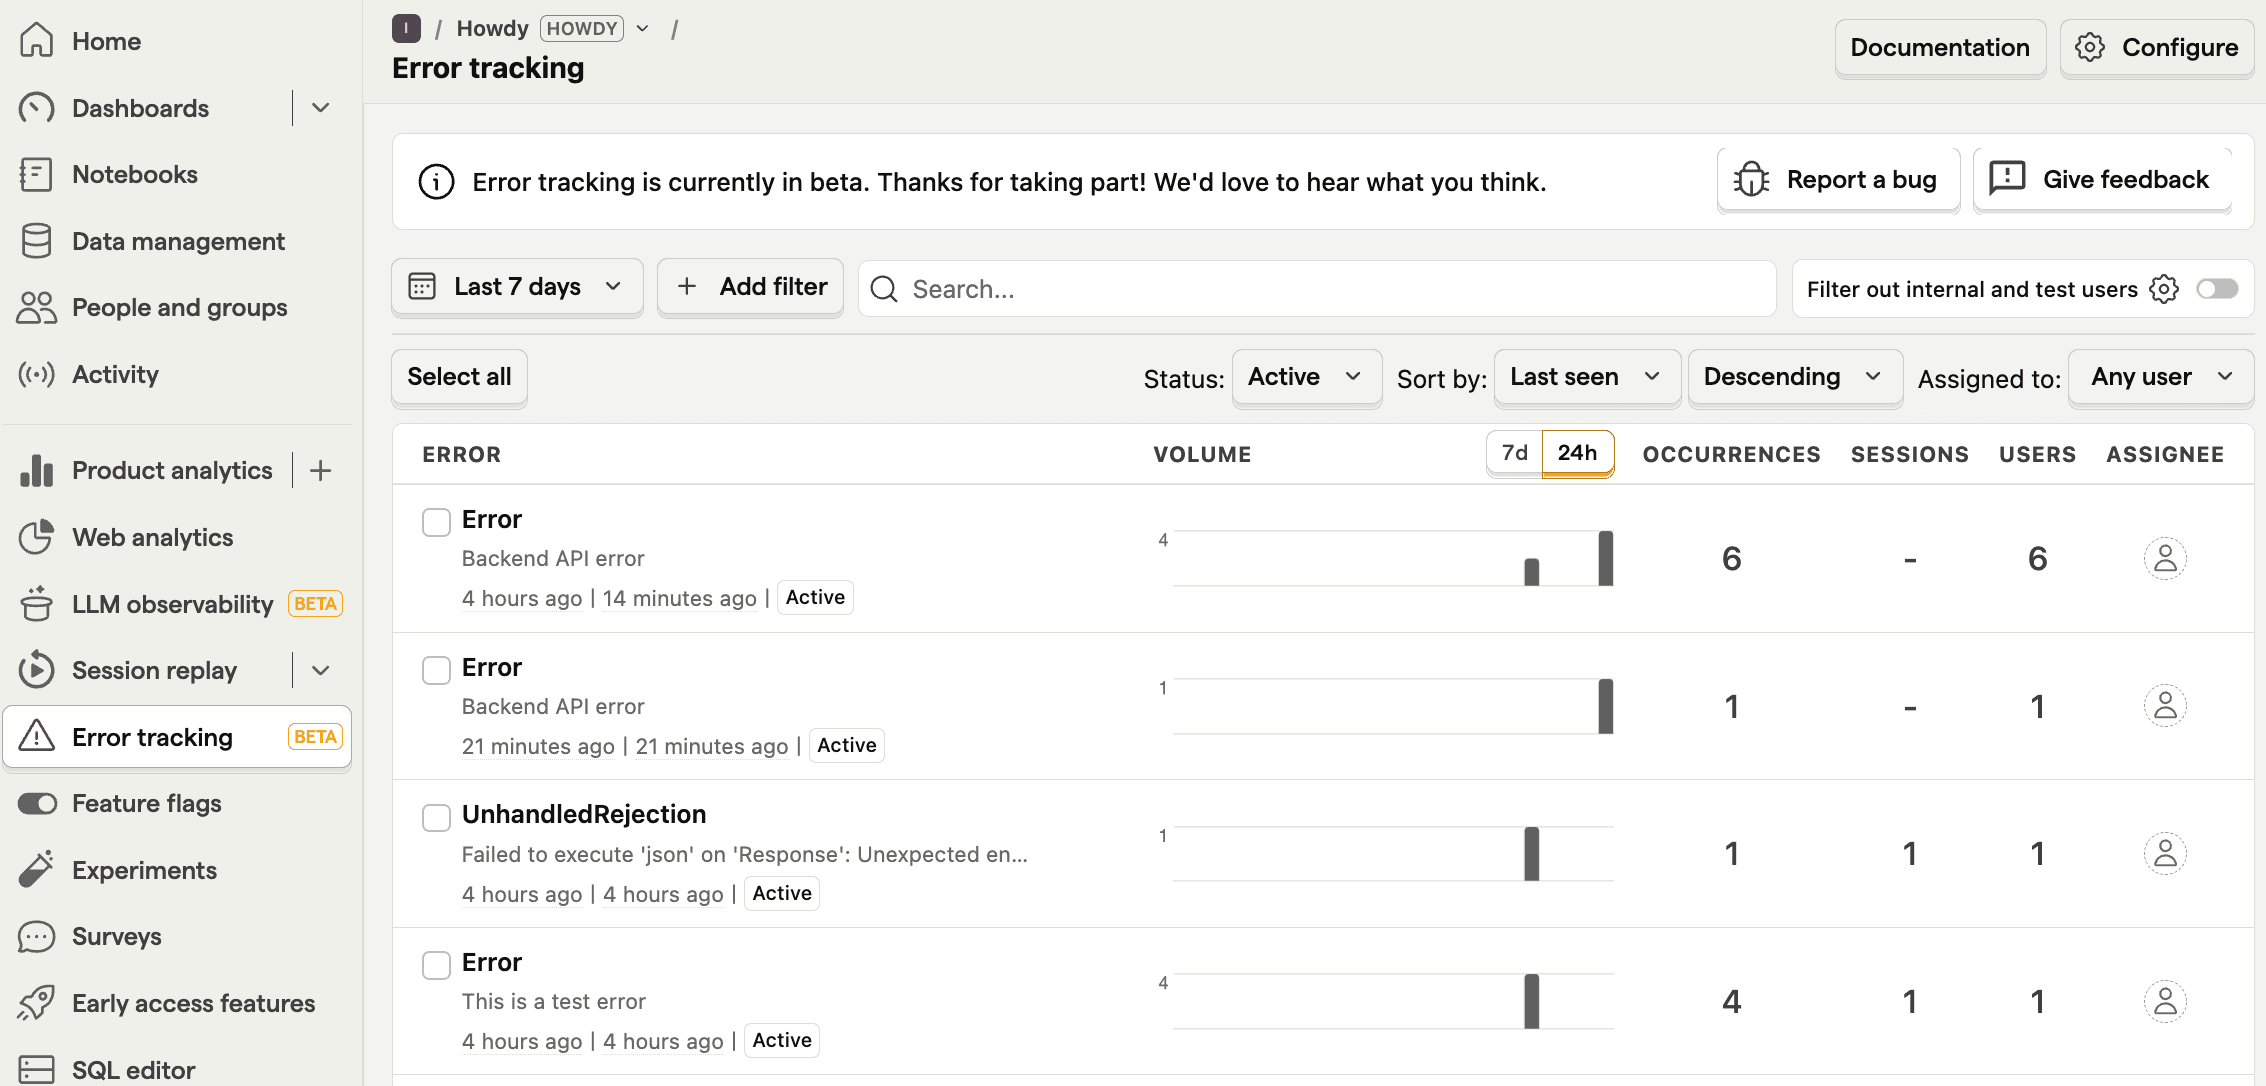
You can click into any of these errors to get more details on them, including a stack trace as well as archive, resolve, or suppress them. On top of this, you can analyze $exception events like you would any event in PostHog, including setting up trends for them and querying them with SQL.
Questions? Ask Max AI.
It's easier than reading through 623 docs articles.